As the digital landscape continues to rapidly evolve, marketers are responsible for an expanding number of digital touchpoints. This means that brands striving to deliver seamless omnichannel experiences face the challenge of juggling an increasing volume of content across these platforms.
As a platform that integrates seamlessly with E-commerce, we’ve investigated the latest trends in the industry when it comes to creating, managing and sharing assets in a 2024 omnichannel marketing strategy.
To provide data-driven insights for online retailers, we have collected key statistics on digital asset management and customer touchpoints, drawing from Bynder’s 2024 research and other external sources.
What is a touchpoint?
Marketing touchpoints are the various interactions or points of contact between a customer and a brand. In the virtual space, these include digital channels such as social media platforms, websites, emails, and mobile apps. Examples of touchpoints include actions like a visitor clicking on a link, downloading an ebook, or engaging with a social media post.
How many touchpoints are used in the average E-Commerce marketing strategy?
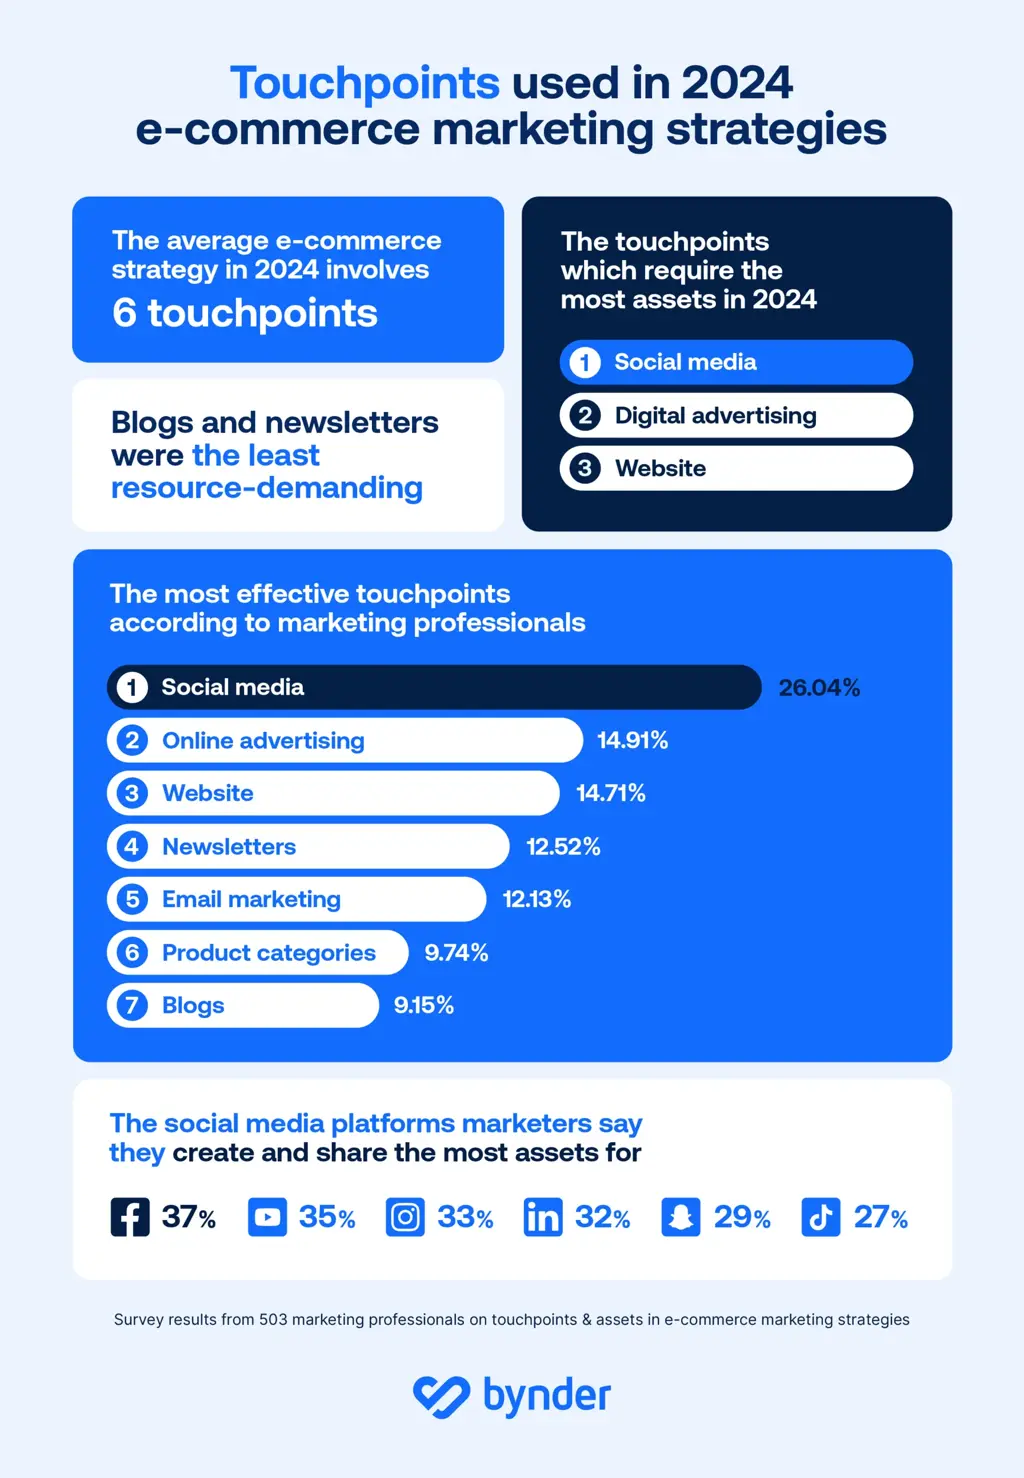
The average E-commerce marketing strategy involves six (specifically 5.7) touchpoints, according to our recent survey of 503 marketing professionals across the UK and US.
However, there is a notable variance based on company size and industry:
- Larger enterprises: Companies with a higher number of staff utilize the most amount of touchpoints, reflecting greater resources and need for a multi-faceted approach.
- Smaller businesses: Conversely, smaller companies (1-9 employees) often focus on fewer touchpoints with an average of 4.9, likely due to resource constraints and a more targeted marketing approach.
- Industry leaders: Travel & Transport lead the way as having the highest average number of touchpoints (9.9), followed by Manufacturing & Utilities (5.31).
Which digital touchpoints perform the best and worst in 2024?
Social media was found to be the most effective digital touchpoint in 2024, with a quarter of marketing professionals at E-commerce brands in agreement.
Considering 96% of first-time visitors to an online store will exit without making a purchase, nearly all initial traffic must be re-engaged through off-site marketing, highlighting the importance of digital touchpoints at this stage.
Based on our survey data, touchpoints were ranked in terms of the most to least effective in 2024, according to respondents' selection of their top-performing touchpoints:
- Social media: 26%
- Online advertising: 15%
- Websites: 15%
- Newsletters: 13%
- Email marketing: 12%
- Product catalogues: 10%
- Blogs: 9%
Social media, online advertising, and websites are the top three touchpoints, making up over 50% of the responses. Blogs, while still used, are considered less effective compared to other channels.
What are digital marketing assets?
A digital marketing asset is defined as any type of data that exists in digital form, such as an image, video, audio file, social media asset, website asset, and sales and marketing collateral. Content assets are the materials used to engage customers at each touchpoint. Each type of content asset serves a specific purpose in driving engagement and guiding customers through their journey.
How many assets are involved in an omnichannel marketing strategy for E-commerce brands in 2024?
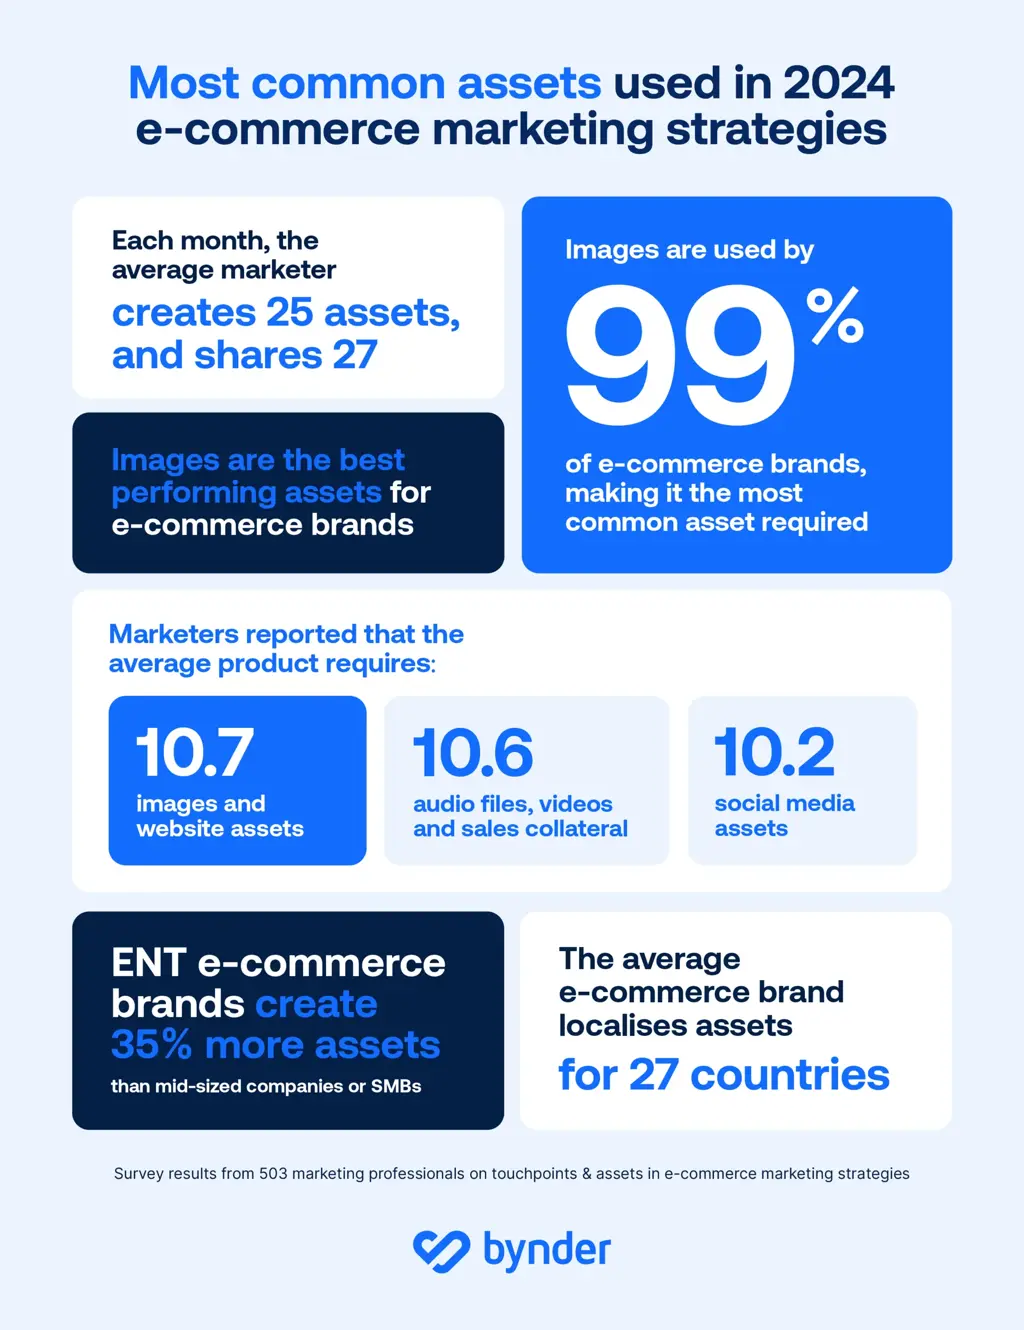
Generally, marketers create an average of 25 assets and share 28 per month.
Most businesses create and share between 21-30 assets each month, with a significant portion managing even higher numbers. Marketers in the Healthcare sector create the most assets on average (30) per month, while the Travel & Transport sector share the most (37).


Here is the how marketers in various sectors vary when it comes to creating and sharing assets each month:
Industry | Assets created per month | Assets shared per month |
Architecture, Engineering & Building | 17.14 | 20.24 |
Arts & Culture | 25.87 | 23.13 |
Education | 24.29 | 32.71 |
Finance | 26.57 | 27.14 |
Healthcare | 30.14 | 25.57 |
HR | 27.14 | 25.44 |
IT & Telecoms | 27.96 | 27.08 |
Legal | 24.73 | 29.55 |
Manufacturing & Utilities | 24.12 | 25.92 |
Retail, Catering & Leisure | 21.83 | 22.98 |
Sales, Media & Marketing | 22.16 | 24.3 |
Travel & Transport | 27.69 | 37.38 |
As for company types, the number of assets managed were also found to vary:
- SMB: Marketers manage 20 assets per month on average
- Mid: Marketers manage 24.5 assets per month on average
- Enterprise: Marketers manage 26.5 assets per month on average
Which type of assets performed best and worst in 2024?
Respondents were asked which kinds of assets they felt performed the best and the worst in 2024.
Voted as best performing asset:
- Image: 60%
- Social media asset: 60%
- Video: 57%
- Sales and marketing collateral: 57%
- Website asset: 57%
- Audio file: 53%
Voted as worst performing asset:
- Audio file: 31%
- Video: 31%
- Sales and marketing collateral: 31%
- Website asset: 30%
- Social media asset: 27%
- Image: 26%
Which social media platforms are most often involved in E-commerce marketing strategies?
Our survey uncovered that Facebook is the social media platform being leveraged most frequently in the E-commerce space by marketers in 2024.
The most to least used social media platforms for E-commerce brands are:
- Facebook: 37%
- Youtube: 35%
- Instagram: 33%
- LinkedIn: 32%
- Snapchat: 29%
- TikTok: 27%
- Reddit: 21%
- Pinterest: 20%
- X (Formerly Twitter): 18%
How many assets are involved in an omnichannel marketing strategy for E-commerce brands in 2024?
Social media was found to be the most resource-intensive touchpoint for brands, requiring the highest amount of assets to be created and shared.
Social media was found to require an average of 20.15 assets per month; followed by digital advertising, requiring 19.73 assets per month on average.
Here’s a breakdown of the touchpoints which marketers create and distribute assets for:
- Social media: 39%
- Digital advertising: 33%
- Website: 30%
- Email marketing: 27%
- Marketplaces: 26%
- Mobile apps: 24%
- Newsletter: 20%
- Blogs: 20%
Which types of assets are required the most within an E-commerce strategy?
Images are the most commonly used asset types across all platforms, with 99% of respondents using this asset for the average product.
We uncovered the average number of assets required for a singular product are:
- Image: 10.72
- Website asset: 10.68
- Audio file: 10.66
- Sales and marketing collateral: 10.65
- Video: 10.59
- Social media asset: 10.2


Which shopping seasons require the most assets for E-commerce brands?
Christmas was found to be the most demanding season for assets, followed by Valentine’s Day and Summer Sales.
Marketers were asked which shopping season requires the most assets to be created. The answers, ranked from the most to least popular, were:
- Christmas: 18%
- Valentine’s Day: 16%
- Summer Sales: 12%
- New Years: 12%
- Black Friday: 11%
- Cyber Monday: 8%
- Father’s Day: 8%
- Boxing Day: 6%
- Mother’s Day: 6%
Which month do marketers find themselves creating, managing and sharing the most assets?
December, February and April are the top months where assets are managed, while October, November and September require the least number of assets.
Ranking of months from most to least, with average numbers of assets created and shared, participants said:
- December: 15%
- February: 14%
- April: 14%
- May: 10%
- June: 10%
- March: 9%
- January: 6%
- July: 5%
- August: 5%
- November: 4%
- September: 3%
- October: 2%
Industry-specific considerations
Some respondents in Bynder’s survey share that luxury goods and high-tech products are categories requiring extensive digital assets, particularly during major shopping seasons.
This aligns with findings from a Norsat study which reveals two-thirds (66%) of high-end shoppers now feel more comfortable making expensive online purchases than pre-pandemic, yet 90% believe luxury brands lag behind their high street counterparts in online experience.
Together, these insights highlight the critical need for brands in both luxury and tech sectors to enhance their digital presence and build consumer trust through high-quality content.
How many countries do marketers localize their digital content assets for?
The average E-commerce brand localizes assets for 26 countries. More specifically:
- N/A (Do not localise assets for any countries): 2.39%
- 1-10 countries: 13.92%
- 11-20 countries: 14.51%
- 21-30 countries: 30.22%
- 31-40 countries: 24.06%
- 41-50 countries: 10.14%
- 51-60 countries: 1.99%
- More than 60 countries: 0.99%
- Unsure: 1.79%
Conclusion
As the E-commerce space becomes increasingly complex, businesses may adapt by refining their touchpoint strategies and optimizing content asset management with these data insights.
By understanding the unique demands of their industry, the specific needs of their target demographics, and the seasonal peaks that require the most resources, companies can craft more effective and efficient marketing campaigns.
The respondents highlighted that the key to success in 2024 lies in balancing the breadth of touchpoints with the depth of content.
By utilizing Bynder, E-commerce brands are enabled to deliver the right content to the right audience at the right time to ensure hyper-relevance while managing personalization, time-to-market, brand consistency, distribution, and performance across the growing number of channels and touchpoints.


